
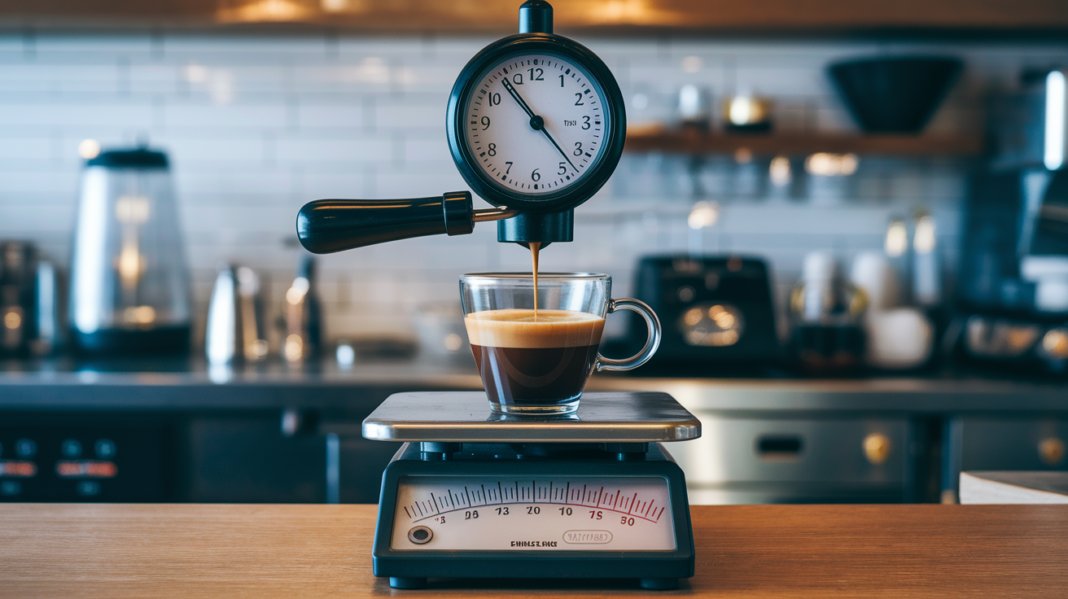

Is your espresso timer lying to you?
Most people judge shots by total time and taste later.
That wastes beans and makes dialing inconsistent.
Flow-rate graphs give live grams-per-second feedback.
Read the first 5–10 seconds and you can predict whether a shot will finish in 25–30 seconds.
You can abort a bad pull or tweak grind, dose, pre-infusion, and pressure before you waste coffee.
This post teaches simple, repeatable rules: read early flow signals, use a quick grams-per-second check to estimate remaining time, and make one change that fixes the shot.
Immediate Flow-Graph Interpretation for Optimizing Espresso Shot Timing

The first 5 to 10 seconds of flow data show you whether your shot will land inside or outside the 25 to 30 second window. If the graph starts near zero and barely crawls past 0.5 grams per second by the ten second mark, you’re looking at a slow, over-extracted shot that’ll probably push 35 to 40 seconds or longer. On the flip side, if flow jumps to 2 or 3 g/s within five seconds and holds or speeds up, you’re headed for a sub-25-second finish with thin, sour flavors and low extraction yield. Reading those early seconds as live feedback lets you abort a bad pull or tweak grind, dose, and pre-infusion pressure before the next round.
Instantaneous flow (the moment-by-moment grams-per-second readout) acts as a running timer prediction. Divide your target yield (say 36 grams) by the current flow rate to estimate remaining seconds. When you see steady 1.2 g/s after pre-infusion and you’ve collected 12 grams so far, simple math says you have 24 grams left and roughly 20 seconds remaining (24 ÷ 1.2), putting you on track for a 30 second total if the curve holds stable. If flow suddenly climbs to 2 g/s late in the shot, that same 24 grams will arrive in just 12 seconds, compressing your finish and likely pushing total time below 25 seconds unless you’ve already collected most of your yield.
The cumulative volume trace (how many grams have landed in the cup over time) adds a second timing check. A smooth, linear climb on the cumulative line confirms consistent flow and predictable timing. Sharp bends, plateaus that drag on, or sudden vertical jumps all signal timing chaos. When the cumulative curve flattens between seconds 10 and 20, you’re stalled. When it spikes upward after second 20, you’re gushing. Both patterns wreck the 25 to 30 second window and point to immediate corrections in grind resistance or flow settings.
Early flow-rate signals and their timing implications:
Flat or near-zero flow in the first 5 seconds. Warns of stalled extraction. Shot will likely exceed 30 seconds and risk bitterness from prolonged contact.
Rapid climb above 2 g/s by second 5. Predicts a fast finish under 25 seconds. Expect sour, thin espresso with extraction yield below 18%.
Smooth ramp to 1 to 1.5 g/s by second 8 to 10. On pace for a 25 to 30 second shot at typical 1:2 ratio (18 g in, 36 g out).
Sudden spike mid-shot (flow jumps 0.5+ g/s in 2 seconds). Channeling event. Total time becomes unpredictable, often finishing too fast as water finds an easy path.
Gradual decline after second 20. Gentle taper toward finish. If decline is controlled, shot lands near 28 to 30 seconds with balanced extraction.
Accelerating flow after second 20. Puck is collapsing or resistance dropping. Shot finishes early, risking under-extraction even if cumulative yield looks correct.
Physics Behind Espresso Flow Behavior and Extraction Dynamics
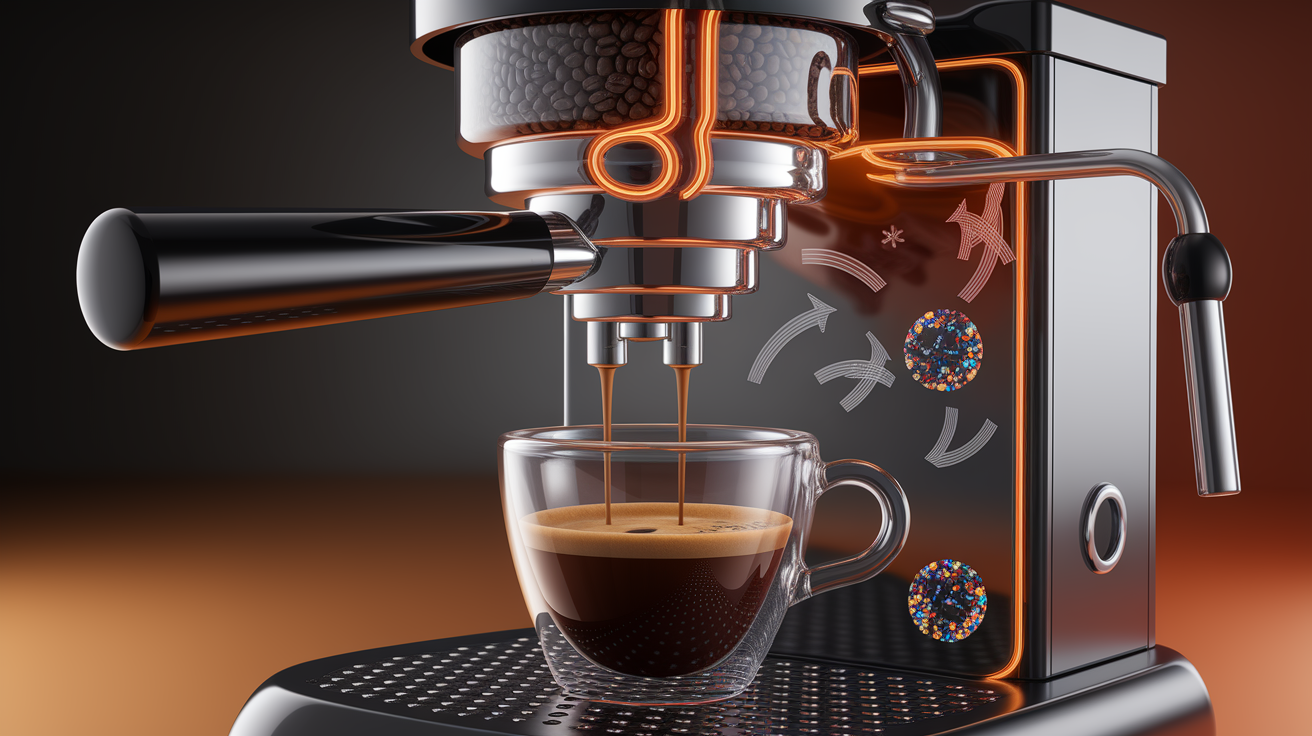
Flow-rate graphs plot instantaneous grams per second (g/s) or milliliters per second on the vertical axis against elapsed shot time on the horizontal axis. Cumulative yield curves overlay total beverage mass collected. Flow itself obeys a simple relationship: flow rate increases with higher pressure differential across the puck and decreases with higher resistance from the coffee bed. Pump pressure provides the driving force (typically 9 bar at the pump and around 9 to 10 bar at the group head) while puck resistance (determined by grind size, dose mass, particle distribution, and compaction) throttles how much water can pass per second. When resistance stays constant and pressure remains steady, flow holds a stable plateau. When resistance rises because particles swell or fines migrate and clog, flow drops. When resistance falls because the puck fractures or channels open, flow spikes.
Extraction dynamics layer chemistry onto that physical flow. Soluble compounds dissolve at different rates: acids and light aromatics extract quickly in the first few seconds, sugars and balanced flavors develop through the middle phase, and heavy bitter compounds leach out during prolonged contact. Faster average flow shortens contact time, limiting how much of each compound dissolves and typically lowering both extraction yield (the percentage of coffee mass that ends up in the cup) and total dissolved solids (TDS, the strength of the beverage). Slower flow extends contact, raising extraction yield and TDS but risking over-extraction if time stretches too long. The ideal flow profile ramps gently to allow even wetting and early acid extraction, holds a controlled mid-shot plateau to build sweetness and body, then tapers to prevent late over-extraction. All within a 25 to 30 second window that historically balances yield around 18 to 22% and TDS around 8 to 12%.
Non-ideal behaviors trace directly to disruptions in pressure and resistance balance. A sawtooth or oscillating flow pattern often signals pump instability, air pockets in the system, or dose inconsistency that creates uneven resistance as the piston cycles. Sharp upward spikes indicate sudden resistance drops (channeling, where water finds a crack or void and rushes through, bypassing most of the coffee bed). Slow ramps or plateaus that creep upward point to progressive clogging by fines or insufficient pressure to overcome initial resistance. All these deviations shift contact time and solvent exposure, altering extraction yield and flavor balance in ways that appear immediately on the graph before you taste the cup.
Adjusting Espresso Grind, Dose, and Puck Prep Using Flow-Rate Graph Signals
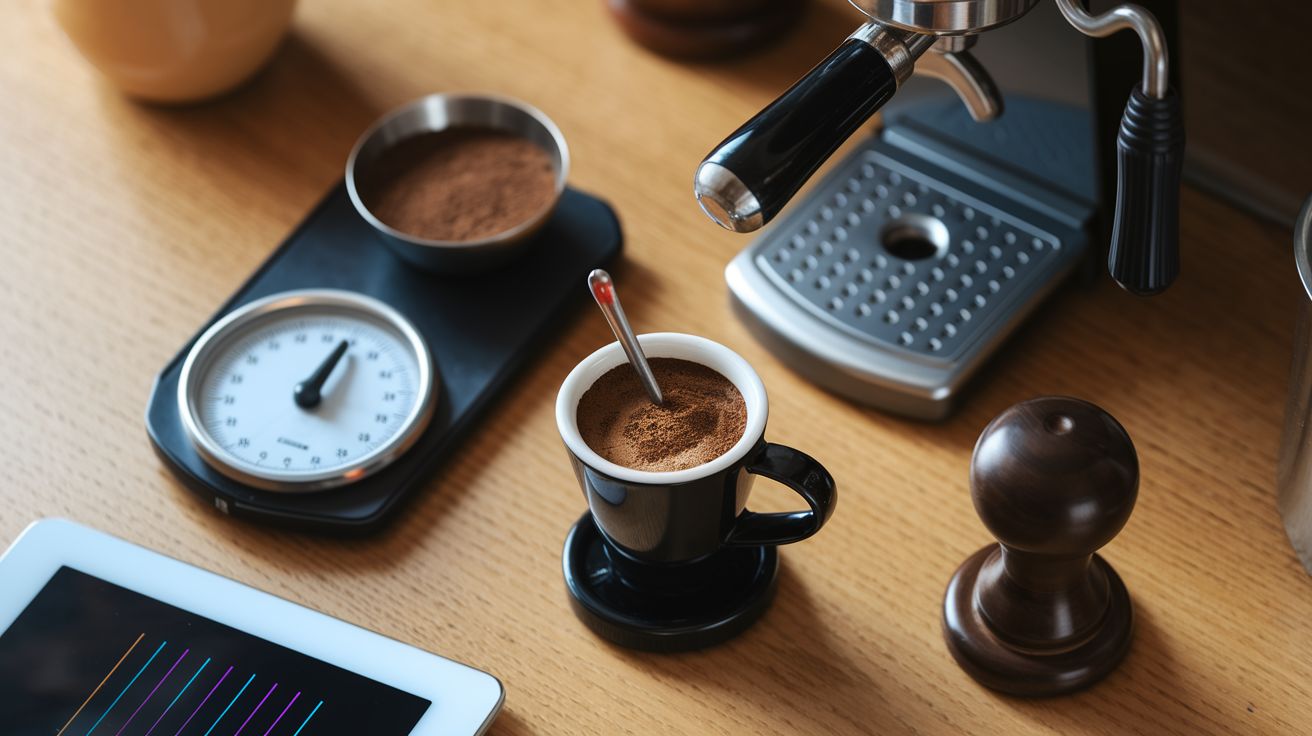
When flow barely moves in the first ten seconds (hovering near or below 0.5 g/s), your grind is too fine, your dose is too high, or your tamp has compacted the puck into a brick. Water can’t penetrate evenly, pre-infusion stalls, and the shot drags past 30 seconds into bitter, astringent territory. The fix starts with grind: back off one or two clicks on a stepped grinder or a tiny rotation on stepless, then pull another shot and watch the graph. If the slow start persists, reduce dose by half a gram rather than continuing to coarsen, because an overfilled basket adds resistance even at the same grind setting. If both adjustments still leave you with a sluggish ramp, check your tamp pressure and puck prep. Over-tamping or uneven distribution can create dense zones that choke flow regardless of grind size.
Fast finishes (where flow climbs steeply after second 20 or the cumulative yield curve bends sharply upward) usually mean the opposite problem: grind too coarse, dose too light, or puck degradation as the coffee bed breaks apart under pressure. Tightening the grind by one small increment raises resistance and slows late-stage flow. Adding 0.5 to 1.0 gram to the dose increases the total coffee bed depth and particle count, which also builds resistance and extends contact time. If those steps over-correct and you swing into a slow start, split the difference: slightly coarser than the tight setting and slightly higher dose than the light one. The goal is a flow curve that holds steady through the middle phase and tapers gently rather than spiking or collapsing.
Channeling appears as sharp, irregular spikes. Flow jumps suddenly by 0.5 g/s or more within a couple of seconds, then may drop back or continue erratically. The cause is almost always uneven puck preparation: clumpy grinds, poor distribution, off-center or tilted tamping, or a dirty basket with residue creating gaps. Weiss Distribution Technique (WDT), using a thin needle or purpose-built tool to stir the grounds and break up clumps, addresses distribution. A level, consistent tamp pressure applied straight down addresses compaction evenness. If spikes persist after improving prep, try grinding very slightly finer. Sometimes a coarser grind leaves larger voids that are prone to breakthrough, and a modest tightening can unify resistance across the puck. Always check your portafilter basket for damage, crud on the rim, or worn mesh that can create preferential flow paths.
Basket resistance and headspace also show up in flow behavior. An underfilled basket (low dose) offers less resistance and flows fast. An overfilled basket that contacts the shower screen before locking in can cause uneven wetting and stalling. If your graph shows wild swings or inconsistent plateaus across repeated shots using the same grind and dose, inspect the basket for cleanliness and verify you’re dosing within the basket’s rated range (typically 18 to 22 grams for a double). Small changes (moving from 18 to 19 grams or switching to a precision basket with more uniform holes) can stabilize flow and smooth out timing.
Graph pattern, cause, fix summary:
Slow start (flow under 0.5 g/s first 10 s). Too fine, too much dose, or over-tamped. Coarsen grind slightly, reduce dose 0.5 to 1 g, or lighten tamp pressure.
Fast finish (flow spikes above 2 g/s after 20 s). Too coarse, too little dose, or puck collapse. Grind finer by one step, increase dose 0.5 to 1 g, or tamp more evenly.
Channeling spikes (sudden jumps mid-shot). Clumpy distribution, uneven tamp, or basket defects. Use WDT to distribute, level tamp, clean or replace basket.
Sawtooth oscillation (repeated small spikes and dips). Pump instability, air in system, or inconsistent dose. Purge air, check dose precision (±0.1 to 0.2 g), verify pump and plumbing.
Flat plateau that never ramps. Extreme resistance or insufficient pump pressure. Coarsen significantly, reduce dose, or confirm machine pressure is set correctly (typically 9 bar).
Using Flow-Rate Curves to Fine-Tune Pressure, Pre-Infusion, and Shot Structure
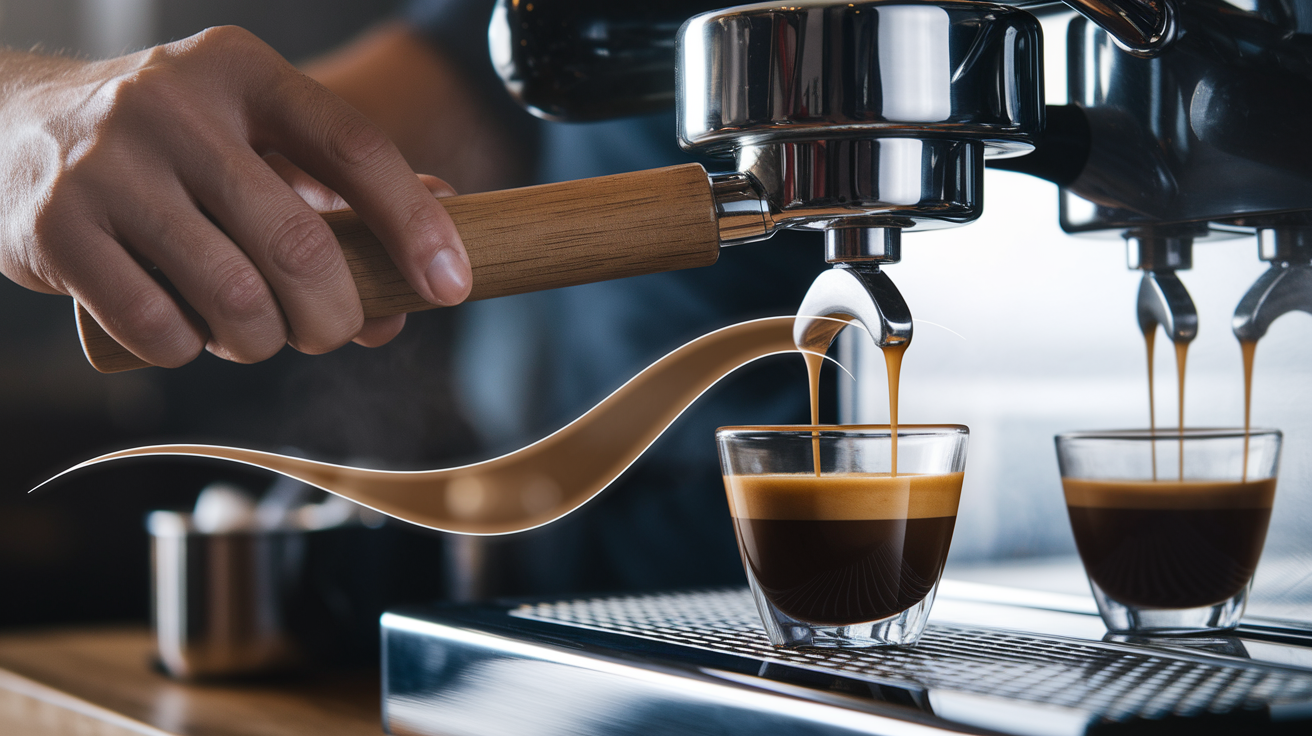
Pre-infusion (delivering water at low pressure before full extraction begins) shapes the early seconds of the flow graph and sets up puck stability for the rest of the shot. Machines with flow or pressure profiling let you hold brew pressure around 0 to 2 or 0 to 3 bar for the first several seconds, allowing the coffee bed to wet evenly and swell gently without fracturing. On a flow graph, good pre-infusion shows as a low, controlled ramp (often 0.2 to 0.8 g/s) that gradually climbs as the puck saturates and pressure builds. If you skip pre-infusion or ramp pressure too aggressively, the graph often shows a sudden spike or erratic start as water punches through dry zones and creates channels. Lengthening pre-infusion time (say from three seconds to eight seconds) smooths that initial ramp and delays the main plateau, which can push total shot time toward the upper end of the 25 to 30 second window and improve sweetness by giving acids and sugars more gradual extraction.
Mid-shot pressure plateau is where most of the extraction happens. A typical profile ramps from low pre-infusion pressure up to 6 to 9 bar over a few seconds, then holds that pressure (or holds the resulting flow rate) steady. On the graph, this appears as a flat or gently climbing section where flow stays consistent. If the plateau is too high (above 3 g/s), the shot finishes fast and under-extracts. If it’s too low (under 1 g/s), the shot drags and risks bitterness. Adjusting mid-shot pressure or flow (opening a manual flow paddle, tweaking a needle valve, or programming a lower pump pressure on a digitally controlled machine) shifts that plateau up or down. Light roasts, which are denser and extract more slowly, often benefit from a slightly higher mid-shot flow to keep total time reasonable. Dark roasts, which extract quickly, may taste better with a lower plateau to avoid pulling harsh, burnt notes.
Tapering flow or pressure at the end of the shot prevents the fast-finish spike that appears when puck resistance drops as the coffee bed compresses and fines migrate. On manually controlled machines, closing the flow paddle slightly after 20 seconds extends the tail of the curve and can add a few extra seconds of controlled extraction without the runaway gush that leads to astringency. On programmable machines, a declining pressure ramp (say from 9 bar down to 6 or 4 bar over the final ten seconds) produces a gentle downward slope on the flow graph and often improves clarity and balance in the cup.
Roast-specific flow adjustments (short examples):
Light roasts or fresh beans (high CO₂). Use extended low-pressure pre-infusion (5 to 10 seconds at 0 to 2 bar) to allow gas release, then moderate mid-shot flow to avoid stalling. Total time often 28 to 35 seconds.
Dark roasts or aged beans. Shorter, higher-pressure pre-infusion (3 to 5 seconds) to prevent over-soaking porous structure, then lower mid-shot flow or early taper to keep extraction under control. Target 25 to 28 seconds.
Blends or medium roasts. Balanced pre-infusion (4 to 6 seconds), steady mid-shot plateau around 1.2 to 1.5 g/s, gentle taper at end. Aim for 26 to 30 seconds and adjust grind to fine-tune yield and strength.
Calculating Shot Timing Targets Through Flow Data and g/s Measurements
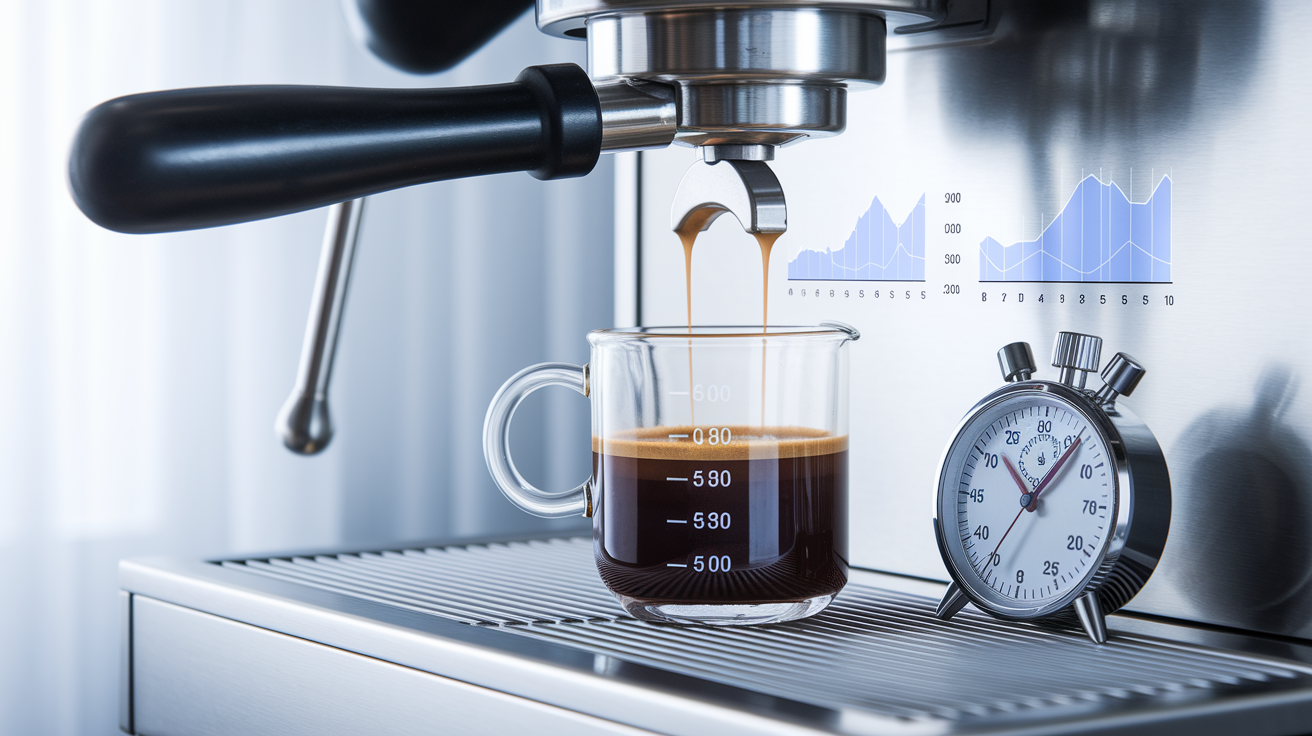
To measure instantaneous flow rate on a manual machine, run water through the group (with no coffee) for exactly 20 seconds and collect the output on a scale. Divide the grams collected by 20 to get your average flow in grams per second. For example, if you collect 30 grams in 20 seconds, your flow rate is 1.5 g/s. Repeat this test at several valve positions (common points to test are one-eighth turn open, one-quarter, one-half, three-quarters, one full turn, and one-and-a-quarter turns) so you build a map of valve position to flow rate. Machines with flow meters or programmable pumps display g/s in real time, but the same principle applies: knowing your flow rate lets you predict shot timing before you pull the shot.
The core formula is simple: desired extraction time (in seconds) equals target yield (in grams) divided by flow rate (in grams per second). If you want 36 grams of espresso in 30 seconds, you need a flow rate of 36 ÷ 30 = 1.2 g/s. If your measured flow at half-turn open is 1.5 g/s, that same 36 gram yield will arrive in 36 ÷ 1.5 = 24 seconds (too fast). To slow it down, you can either close the valve to a position that measures closer to 1.2 g/s or grind finer so puck resistance reduces effective flow even at the half-turn setting. If measured flow at quarter-turn is only 0.9 g/s, your 36 gram yield will take 36 ÷ 0.9 = 40 seconds (too slow). Open the valve more or coarsen the grind slightly to raise flow and bring timing back into the 25 to 30 second window.
Applying this in practice: suppose you measure six valve positions and record 1.6 g/s at position A, 2.1 g/s at position B, and 2.8 g/s at position C. You want a 1:2 ratio (18 grams in, 36 grams out) in roughly 28 seconds. That means you need 36 ÷ 28 ≈ 1.29 g/s. None of your measured positions hit exactly 1.29 g/s, so you interpolate: set the valve slightly above position A (which gave 1.6 g/s) or adjust grind to increase resistance until the effective flow drops from 1.6 g/s down to around 1.3 g/s. Pull a test shot, watch the real-time flow graph, and confirm that the plateau sits near 1.3 g/s and the cumulative yield reaches 36 grams around the 28 second mark. Log the grind setting, valve position, dose, and resulting time so you can repeat it.
| Measured Flow (g/s) | Predicted Shot Time for 36 g Yield |
|---|---|
| 0.9 | 40 seconds |
| 1.2 | 30 seconds |
| 1.5 | 24 seconds |
Visual Pattern Recognition on Flow Graphs for Accurate Shot Timing Diagnosis

Ideal flow curves look like a smooth hill: a gentle upward ramp during pre-infusion (first 5 to 10 seconds), a flat or very slightly rising plateau through the middle (seconds 10 to 25), and a gradual taper as flow declines toward the end (seconds 25 to 30). The cumulative yield trace climbs steadily without abrupt bends, crossing your target yield (say 36 grams) right around the 28 to 30 second mark. When you see that shape across three consecutive shots, you know grind, dose, distribution, and pressure are all aligned, and timing will be consistent.
Deviations tell you exactly where the problem lives. A slow, flat start (where the flow line stays near zero for the first five seconds then suddenly jumps) warns that pre-infusion is stalling and the shot will finish late, often past 35 seconds. A sharp spike within the first ten seconds, especially if the line jumps and then drops back, signals early channeling. Total timing becomes a guess because part of the puck is bypassed. A fast initial surge (flow hitting 2 to 3 g/s by second five and holding high) predicts a sub-25-second finish with thin, sour flavors and low extraction yield. A late upward spike (flow climbing steeply after second 20) means the puck is collapsing and the shot will gush to finish, compressing the tail and risking astringency even if the first 20 seconds looked good.
Reading the first five seconds as a timing prediction works because resistance and pressure dynamics stabilize quickly once pre-infusion ends. If flow ramps smoothly to around 1 to 1.5 g/s by second eight and holds, you’re on pace for a controlled 25 to 30 second shot. If it’s still under 0.5 g/s at second ten, you’re heading long and need to coarsen or open flow. If it’s above 2 g/s at second five, you’re heading short and need to tighten grind or close flow.
Visual signatures and timing implications:
Slow ramp to plateau (flow under 0.8 g/s at second 10). Shot will likely exceed 30 seconds. Coarsen grind or reduce dose to speed up.
Fast initial surge (flow above 2 g/s by second 5). Shot will finish under 25 seconds. Grind finer or close flow valve to slow down.
Mid-shot spike (sudden 0.5+ g/s jump between seconds 10 to 20). Channeling. Timing becomes unpredictable, often finishing too fast. Improve puck prep and distribution.
Late upward bend (flow increases after second 20). Puck collapsing. Shot finishes early with harsh tail. Grind finer, increase dose, or taper pressure or flow at end.
Practical Espresso Workflow for Dialing In Using Flow-Rate Graphs

Start by stabilizing your dose within a tight window (±0.1 to 0.2 grams) because dose variability changes puck resistance and makes flow graphs impossible to compare shot-to-shot. Weigh every dose before distribution, zero your scale if needed, and use the same basket every time until you’ve locked in a recipe. Once dose is stable, pull three consecutive shots using the same grind setting, tamp pressure, and flow or pressure profile, then review all three flow graphs side by side. If all three show the same shape and timing, you have a repeatable baseline. If they vary wildly, the problem is usually inconsistent puck prep (clumpy distribution, uneven tamp) or air in the system. Fix those before changing grind or flow.
Next, analyze the baseline graphs for timing and shape. Check where cumulative yield crosses your target (say 36 grams) and confirm total shot time. If all three shots finish at 32 to 34 seconds and the flow plateau looks stable, you’re close. Small grind adjustment or slight valve change will dial it in. If timing is way off (under 20 seconds or over 35 seconds), make a larger single-variable change: coarsen or tighten grind by two or three clicks, or shift the flow valve by a quarter-turn, then pull another set of three and compare graphs again. Resist the urge to change grind and dose and tamp and flow all at once. You won’t know which variable fixed (or wrecked) the result.
When you land on a flow curve that hits your timing target and tastes balanced, log everything: grind setting (including burr type and age), dose (in grams to one decimal), basket type, tamp pressure or technique, valve position or programmed flow profile (with pre-infusion duration and ramp timings), brew temperature, and final yield. Export or screenshot the flow graph if your machine supports it. This snapshot becomes your reference recipe. The next morning or the next bag of beans, pull a shot using those exact settings and compare the new flow graph to the saved one. If the new graph matches, timing and flavor should match. If it drifts (earlier plateau, later finish, new spikes), you know something changed (bean age, grinder calibration, basket condition) and you adjust one variable to bring the graph back in line.
Track small iterative changes in a simple notebook or spreadsheet. Write down each adjustment (“grind two clicks finer, dose increased 0.5 g”) and the resulting flow-graph change (“plateau dropped from 1.8 g/s to 1.4 g/s, finish moved from 24 s to 28 s”). Over a few days, patterns emerge: you learn how many clicks equal how much flow change on your grinder, how much dose shift is needed to add two seconds, and which puck-prep mistakes create which graph signatures. That knowledge turns dialing-in from guesswork into a predictable process.
Recommended daily flow-based dialing routine (step-by-step):
- Weigh and verify dose consistency (±0.1 to 0.2 g) across three test shots.
- Pull three consecutive shots with identical grind, dose, distribution, tamp, and flow settings. Capture or review flow graphs for all three.
- Identify the dominant graph feature (slow start, fast finish, channeling spikes, stable plateau) and confirm it appears in at least two of the three shots.
- Make one targeted change: adjust grind by 1 to 2 clicks, or shift dose by 0.5 to 1 g, or change valve position or pressure profile by a small increment. Do not change multiple variables.
- Pull another set of three shots with the new setting and compare flow graphs to the baseline. Check whether timing moved toward or away from the 25 to 30 second target.
- Log the change, the resulting graph shape, the final shot time, and tasting notes. Repeat steps 4 to 6 until the flow curve shows a smooth ramp, stable mid-shot plateau around 1 to 1.5 g/s, and gentle taper finishing near 28 to 30 seconds.
Example Flow Profiles and Their Timing Outcomes (Light, Dark, and Fresh Beans)
Light roasts and very fresh beans (high residual CO₂) respond well to gentle, extended pre-infusion that allows gas to escape without creating backpressure and stalling. A common profile uses a quarter-turn valve position (around 1 to 1.5 g/s measured flow) held for the first 15 to 20 seconds, then opens slightly (just under half-turn) for five seconds to build yield, then closes back to slightly above quarter-turn to finish. On the flow graph, this appears as a long, low plateau (first 15 to 20 s), a brief mid-shot bump, then a controlled taper. Total shot time often runs 35 to 40 seconds, which sounds long but works because the low initial flow prevents channeling in the gassy, brittle puck and the extended contact extracts sweetness and clarity without harshness. If you try a standard aggressive profile on fresh light roast (high flow from the start), the graph shows erratic spikes as CO₂ disrupts flow, and the cup tastes sour and thin even if timing looks normal.
Dark roasts and aged or degassed beans extract quickly because the structure is more porous and soluble compounds are readily accessible. An aggressive early flow (starting at one-and-a-quarter turns, around 3 to 4 g/s, for the first 10 to 15 seconds) pulls most of the yield fast, then the valve closes progressively over the next 15 to 20 seconds to taper flow and prevent late bitterness. The flow graph climbs steeply at the start, holds a high plateau briefly, then ramps downward in a smooth decline, finishing around 28 to 32 seconds total. This profile keeps contact time short where it matters (preventing over-extraction of bitter carbons) while still hitting reasonable yield. If you use a gentle, slow profile on dark roast, the graph shows a long, low plateau that drags past 35 seconds, and the cup tastes burnt and astringent because prolonged contact leaches harsh compounds.
Blends and medium roasts sit in the middle and often benefit from a “sweetness bump” profile: moderate flow (half-turn, around 1.5 g/s) for the first 15 seconds to establish extraction, a brief increase to one full turn (around 2.5 g/s) for five or six seconds to boost yield and body, then back down to half-turn to finish gently over the final 10 to 15 seconds. The flow graph shows a steady initial plateau, a noticeable hump in the middle, then a return to steady or declining flow toward the end, with total time around 30 to 36 seconds. This shape tends to maximize sweetness and balance because the mid-shot bump pulls sugars and aromatics without extending contact long enough to extract bitterness.
| Profile Type | Expected Timing Behavior |
|---|---|
| Fresh light roast (gentle pre-infusion) | Long low plateau, slow ramp, 35 to 40 s total; prevents channeling and sourness |
| Dark roast (aggressive early flow, taper) | High early plateau, declining ramp, 28 to 32 s; avoids prolonged bitterness |
| Sweetness bump (moderate, high, moderate) | Steady start, mid-shot flow increase, return to steady, 30 to 36 s; balances body and clarity |
| Standard balanced (steady mid-range) | Smooth ramp to ~1.2 g/s plateau, gentle taper, 26 to 30 s; general-purpose workhorse |
Troubleshooting Timing Issues Visible in Flow-Rate Graphs

Slow early flow (where the graph stays near zero or below 0.5 g/s for the first 10 to 15 seconds) signals excessive resistance from too-fine grind, too-high dose, or over-compacted puck. The shot will drag past 30 seconds and risk bitterness as prolonged contact over-extracts. First remedy: coarsen the grind by one or two clicks and pull another shot. If the graph now shows a quicker ramp to 1 to 1.5 g/s by second 10, timing will improve. If slow start persists, reduce dose by 0.5 to 1 gram to lower total resistance. If both fail, extend pre-infusion time or increase pre-infusion pressure slightly (if your machine allows it) to help water penetrate the dense puck. The graph should show the low-flow pre-infusion section lasting longer but ramping more smoothly into the main plateau without a sudden jump.
Fast pours (where flow jumps to 2 to 3 g/s early and the cumulative yield crosses 36 grams before 25 seconds) indicate insufficient resistance from too-coarse grind, too-light dose, or loose puck prep. The cup will taste sour and weak because contact time was too short to extract sugars and balance. Tighten the grind by one click and watch the graph. A successful adjustment shows the early flow plateau dropping from 2.5 g/s down to around 1.5 g/s and total time stretching toward 28 to 30 seconds. If grinding finer creates a slow start instead (over-correction), back off half a click or increase dose by 0.5 gram to add resistance without choking flow. Confirm dose weight is within your basket’s design range (typically 18 to 22 g for a double) and that you’re tamping with consistent, moderate pressure. Under-tamping can leave a loose puck that offers minimal resistance even at the correct grind.
Channeling peaks (sudden spikes where flow jumps 0.5 g/s or more within a couple of seconds, then may drop or oscillate) break timing predictions because part of the water bypasses the coffee bed. Even if total shot time lands near 28 seconds, the uneven extraction tastes hollow or sour in spots and bitter in others. The fix is almost always improved puck prep: use WDT to break up clumps and distribute grounds evenly in the basket, then tamp straight and level. Pull three shots with better prep and compare graphs. Channeling spikes should disappear or shrink significantly, replaced by a smooth plateau. If spikes remain, inspect your basket for damage, cracks, or uneven holes, and verify your portafilter gasket and shower screen are clean and seated correctly. Mechanical defects can create preferential flow paths that no amount of prep will fix.
Overextraction visible on the graph shows as extended low flow (plateau drags below 1 g/s well past 30 seconds) while underextraction shows as high early flow that finishes the yield too quickly. Both are timing errors. For overextraction, coarsen grind or open the flow valve to raise g/s and compress time back into the 25 to 30 second window. For underextraction, grind finer or close the valve to slow flow and extend contact. Always cross-check with taste: if the graph says 28 seconds but the cup is harsh, you may have late-stage channeling or puck collapse that the graph didn’t catch. If the graph says 28 seconds but the cup is sour, check that your yield target matches your dose (a 1:3 ratio will underextract even at perfect timing).
Graph pattern, timing error, correction:
Flat start, flow under 0.5 g/s at 10 s. Over-resistance, shot >30 s. Coarsen grind, reduce dose, extend pre-infusion.
High early flow, >2 g/s by 5 s. Under-resistance, shot <25 s. Grind finer, increase dose, or close valve.
Mid-shot spike, sudden jump. Channeling, unpredictable timing. Improve distribution (WDT), level tamp, check basket.
Late upward ramp, flow increases after 20 s. Puck collapse, early finish. Grind finer, raise dose, or program declining pressure.
Long low plateau, >35 s total. Overextraction risk. Coarsen, reduce dose, or open valve to raise flow and shorten time.
Enhancing Consistency and Training Baristas With Flow-Rate Graphs

Flow graphs turn subjective “that shot looked good” judgments into objective, repeatable data. When multiple baristas share a bar, individual differences in tamping force, distribution technique, and timing intuition create shot-to-shot variability that customers notice. A flow-graph display or export lets the team align on a target curve (say, a smooth ramp to 1.3 g/s plateau finishing at 28 seconds) and each barista can pull test shots, review their graphs, and adjust grind or prep until their curve matches the target. Logging those settings (grind, dose, valve position, tamp approach) in a shared notebook or app means the morning barista and the evening barista produce the same extraction even if they’ve never worked together.
Training new baristas becomes faster and clearer when you can point to a flow graph and say, “See this spike at 12 seconds? That’s channeling from uneven distribution. Try WDT and pull another shot.” The visual feedback is immediate and specific, unlike vague instructions to “tamp harder” or “grind finer.” After a few sessions reviewing their own graphs, trainees internalize the connection between puck-prep mistakes and graph artifacts, and consistency improves without constant supervision. Flow data also exposes hidden variability: if one barista’s shots always finish two seconds faster despite using the same grind setting, the graph might reveal they’re dosing lighter or tamping softer, and a quick correction brings everyone into alignment.
Final Words
In the action, you learned how to read instantaneous flow and cumulative yield to predict shot duration, spot early 5–10 second warnings, and turn spikes or slow ramps into grind, dose, or puck-prep fixes. We covered pressure shaping, g/s math for timing targets, and a repeatable dialing workflow.
Next step: pick one flow cue, change one variable, and pull three logged shots to confirm the effect.
Keep practicing—using flow-rate graphs to optimize espresso shot timing cuts waste and builds steady, repeatable results.
FAQ
Q: What is the optimal flow rate for espresso?
A: The optimal flow rate for espresso is about 1–1.5 g/s average, producing roughly 36–40 g in 25–30 seconds. Use grams-per-second to predict shot time and tweak grind or dose.
Q: What is the 15-15-15 rule for coffee?
A: The 15-15-15 rule for coffee is not universal; a practical version is 15 g dose, 15-second preinfusion, and a 15-second active pour as a starting test. Taste and adjust from there.
Q: What is the 80 20 rule for coffee?
A: The 80/20 rule for coffee applies Pareto: about 80% of improvement comes from 20% of changes. Prioritize grind, dose, water temperature, and clean equipment for the biggest wins.
Q: What is the 2 1 rule for espresso?
A: The 2:1 rule for espresso means target a beverage weight about twice the dry dose — for example 18 g in to 36 g out — a common balanced starting ratio.